Data Visualization

MOBILE AND WEB APPS
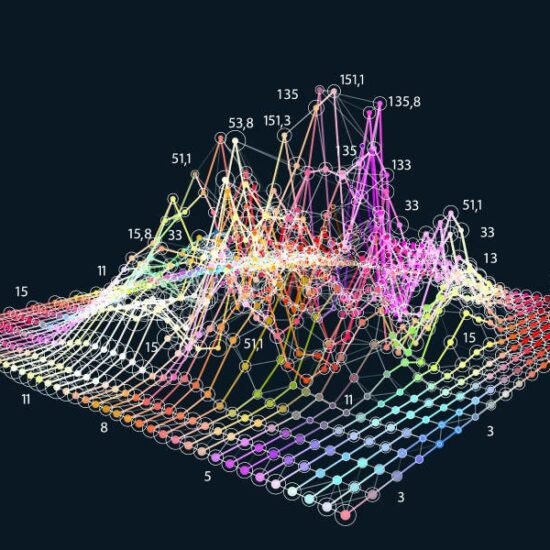
Unleashing Insights Through Visuals: See Your Data Come to Life!
we specialize in providing top-notch data visualization services that help you unlock the power of your data. With our expertise in data analysis and visualization techniques, we transform complex data sets into insightful visual representations that enable you to make data-driven decisions with confidence.
Our team of skilled data scientists and designers work closely with you to understand your unique requirements and goals. Whether you need to present your data in an engaging and interactive way, or you want to uncover hidden patterns and trends, we have the expertise to deliver stunning visualizations that drive your business forward.
Working steps
Our Data Visualization Services include:
Custom Visualizations
We create tailor-made visualizations that align with your specific needs and branding using variety of tools and techniques to design charts,, infographics, and interactive dashboards that effectively communicate your data story. We Visualize Your Data Journey with Precision and Style
Data Storytelling
We go beyond just presenting numbers and charts. Our data visualization services focus on storytelling, transforming complex data into compelling narratives. By combining data, visuals, and narratives, we create impactful visual stories that captivate your audience and drive meaningful engagement.
Interactive Dashboards
We develop intuitive and interactive dashboards that allow you to explore your data dynamically. With user-friendly features such as filters, drill-downs, and real-time updates, our dashboards empower you to gain deeper insights and make informed decisions.
Infographics and Reports
We design visually appealing infographics and reports that condense complex information into easily digestible formats. Our creative approach ensures that your data is presented in a visually appealing manner, making it accessible to a wide range of audiences.
Geographic Mapping
We leverage geographic mapping tools to visualize data on maps, enabling you to understand patterns across different regions. Our maps can display location-specific data, heatmaps, choropleth maps, and other spatial visualizations to enhance your understanding of geographical trends.
Data Animation
We bring your data to life with engaging and dynamic data animations. Through carefully crafted visual sequences, we help you uncover patterns, trends, and correlations that might otherwise go unnoticed. Our data animations provide an immersive experience.
Our feedbacks
what they’re talking?
Reach out to us today for all your needs. We're here to help and provide top-notch support. Contact us now!
Bakry Information Technology delivered a high-quality solution on time and within budget. Excellent communication and attention to detail. Highly recommended.
Mark Thompson
(CEO)
Bakry Information Technology provides innovative solutions that streamline operations. Their prompt response time and technical expertise make them stand out. Highly
Sarah Anderson
IT Manager
Bakry IT delivers exceptional results. Responsive, knowledgeable, and committed to customer satisfaction. Grateful for their expertise.